This is a Wikipediauser talk page. This is not an encyclopedia article or the talk page for an encyclopedia article. If you find this page on any site other than Wikipedia, you are viewing a mirror site. Be aware that the page may be outdated and that the user whom this page is about may have no personal affiliation with any site other than Wikipedia. The original talk page is located at https://en.wikipedia.org/wiki/User_talk:GeogSage.
This editor is within the scope of WikiProject Users, a collaborative effort to rate Wikipedia editors to assess the value of their contributions to the encyclopedia. If you would like to participate, please visit the project page, where you can contest your rating and see a list of open tasks.[Humor]UsersWikipedia:WikiProject UsersUser:Sdkb//WikiProject_Users/templateUsers articles
While your signature is certainly one of the more creative ones I've ever seen on the project, I can't read it unless I zoom it a great deal....and I have 20/20 vision! It just looks like some grey scribbles. WP:SIGAPP says that we should "not make your signature so small that it is difficult to read.". Also, the color you selected for the signature...html grey (Hex #808080)...fails Web Content Accessibility Guidelines regarding contrast, being 3.94:1 where the minimum under WCAG 2.0 AA is 4.5:1. You can test this yourself here. See MOS:COLOR for further guidance. Could you please correct your signature? Thank you, --Hammersoft (talk) 17:36, 20 September 2025 (UTC)[reply]
I changed color to DimGrey (Hex #696969), which should have a contrast of 5.48:1 based on WebAIM Contrast Checker and looks nice. I'm not sure about the size issue, it's just the font Blackadder ITC with the default font size. I do not have 20/20 vision, and on my screen I can read it with standard text settings at 65% zoom no problem, it doesn't become difficult until I zoom out to 50%. GeogSage (⚔Chat?⚔) 18:21, 20 September 2025 (UTC)[reply]
What kind of screen are you on? I've checked it on mobile but work mostly on desktop. Is it the whole signature, or just the talk link that reads "chat?" I've seen other editors use just their initials before, and thought at least the GS portion was legible. I would hate to change it to much, as it's already spread fairly widely, and people might not recognize that it is still "me" if it was too dramatic. GeogSage (⚔Chat?⚔) 01:45, 21 September 2025 (UTC)[reply]
Per the Wikipedia:Signatures#Appearance_and_color "Avoid markup such as <big> and <span style="font-size: 200%;">(or more) tags (which enlarge text); this is likely to disrupt the way that surrounding text displays." I figured this was not a good option to take. I almost made my signature "GS (⚔Chat?⚔) " but decided having the smaller letters was fine per the guideline: "A customised signature should make it easy to identify your username, but this is not required." I figured that the signature was identifiable enough, and it is just the font style at the standard font size. Is it the Chat, or the whole signature? At 100% zoom using standard Wikipedia text size, it seems perfectly legible. Choosing the small font size and zooming out to 65% is where I start to have a problem, but that is true of most sub scripts. GeogSage (⚔Chat?⚔) 04:26, 8 October 2025 (UTC)[reply]
When I think "Signature" I think cursive. A signature is supposed to be distinct, and traditionally a symbol or even thumb print could serve as one. I was aiming for a graphically distinct signature using a font that had a cursive look to it. I don't get to use weird fonts usually, and liked the look of Blackadder itc. I don't think there are any guidelines on font choices, and it seems a bit odd to be overly concerned about when holding a cursor over the link or going to the URL will give the plain text reading. GeogSage (⚔Chat?⚔) 20:21, 10 October 2025 (UTC)[reply]
"Cursive" would be an interesting skin, rendering the entire encyclopedia in one of a selection of cursive styles. In that case the block-letter signatures would be the outliers! Randy Kryn (talk) 08:50, 11 October 2025 (UTC)[reply]
It would, however the purpose of cursive is specifically to make hand writing faster. In written correspondences, or when scribes were mass producing copies of manuscripts, it made sense. As a signature, cursive allows some more pizazz and flourish, but when signing documents makes it easier to quickly write the same thing over and over again. Using cursive as a script for a web page would be a purely aesthetic choice, and would get in the way of function. When it comes to editors signatures, the most important things in my opinion are that it is easy to differentiate and remember between conversations. It really wouldn't matter if that signature was a symbol or words IMO, as long as we can clearly see a mark that indicates who is saying what. I think we need to get the Wikipedia:WikiFun Police to loosen the rules a bit. GeogSage (⚔Chat?⚔) 00:48, 12 October 2025 (UTC)[reply]
It's funny you bring this up. In the early days of web design, mid to late 1990s, people did experiment with using cursive. It looked ridiculous and the fad soon died out. With that said, there is a kind of cursive that looks awesome no matter which medium uses it. It's often referred to as chalkboard menu font, and in recent years, some YouTube channel sites have relied on it more in their video presentations for complex charts and graphs. Viriditas (talk) 10:51, 12 October 2025 (UTC)[reply]
It looks like a wide variety of fonts fall into the category of "chalkboard menu font" from a quick Google search, from cursive to block letters. Any specific examples?
Typography geek subculture is a thing, and has been active online since the internet was invented. I don't know how far back it goes before that, but I do remember reading a book about an active typography subculture in the 1950s and 1960s. If you want to get your students excited about them, there is a wonderful book about it, but I can't recall the name at the moment. Viriditas (talk) 22:52, 12 October 2025 (UTC)[reply]
Deep diving typography would be outside the curriculum, we don't have a lot of time to cover stuff as it is. Therefore, we discuss extreme basics and that Comic Sans if off limits unless they are making something silly. GeogSage (⚔Chat?⚔) 23:11, 12 October 2025 (UTC)[reply]
Given how much chalkboard menu fonts are used in charts and graphs now online, I wonder if it has made any headway into cartography. One thing you do see as really influential in terms of popular journalistic cartography, is the use of hands-on data visualization, particularly tools like datawrapper and their influential look and style.[1] One thing that would make me happy is to see a Wikipedia script implemented that allows editors to create just about any kind of map by plugging in a few fields, such as map type, location(s), and captions. We have nothing like that right now. Just to give you an example: I've got two articles that require maps at the moment, At the Time of the Louisville Flood, which needs a map of flooded Louisville circa 1937 with locations of all the photos in the series. A very similar map exists already that was created by a journalist, but I need one that is unique for the Wiki article. Also, I need a map for Scandinavian migration to the Hawaiian Kingdom, and I want it to show a slowly spinning globe with a dotted line displaying the navigation route of the ships from Norway (and other places) to Hawaii. I already found an old map that documents this route and several ways to make it, but it takes a lot of time. A script that does all of this automatically for articles would be heaven. Any chance your students could create such a project and help make map-making on Wikipedia easier? Viriditas (talk) 23:30, 12 October 2025 (UTC)[reply]
Given how much chalkboard menu fonts are used in charts and graphs now online, I wonder if it has made any headway into cartography.
Hard to tell honestly. I'm sure that it has to some extent, but it's hard to know how. The main concern we have is getting the data frame right, which is why fonts are a small part of the classes.
Any chance your students could create such a project and help make map-making on Wikipedia easier?
Honestly, making maps is probably overly democratized. There are some things that can be done, but making a universal script/program that would make a map with limited inputs would be kind of a philosophers stone, and would essentially end up being an AI slop machine. The issue is cartography, in one sense of the word at least, is a form of graphic design with highly restrictive conventions necessary to avoid lying with maps (recommend the book if you're interested in cartography). There is no regulatory body that oversees cartographic licenses or standards though, so people imitate maps without knowing these conventions and end up misleading people. That said, QGIS, GeoDa, flowmapper and a few others are free and relatively easy to use if you're interested, and you can also make a free ArcGIS Online account. Flowmapper sounds like it might be what you're looking for, maybe. I have thought about trying to weigh in on the Manual of Style for maps, however people really don't want to hear how bad the situation is when it comes to Cartography on Wikipedia. It is pretty hard to discuss with anonymous online people. Imagine getting three degrees on a topic, publishing multiple papers in various formats on it, getting a position as a professor teaching it, and then when you try to weigh in on a conversation three people who are probably not qualified to take your intro class tell you that the criteria you're advocating for is not really a big deal, and the status quo remains. I'm currently thinking about the best way to advocate for things, but this is a mess that would take some work to shine a light on. GeogSage (⚔Chat?⚔) 02:43, 13 October 2025 (UTC)[reply]
Not sure how data visualization could be construed as AI slop if it's using standardized maps and models from Commons. I will read the book you recommended. As for the MOS, it sounds like the confusion is over bottom-up and top-down approaches. Most things make it to the MOS after they end up getting standardized in practice on article pages. That's why I was presenting you with two article examples to make your case. Viriditas (talk) 09:38, 13 October 2025 (UTC)[reply]
Most of the maps in the commons, and on Wikipedia as a whole, range from making amateur mistakes to extremely misleading, with a few good ones. There isn't a single script that can make appropriate maps automatically, so we would end up falling into using generative AI. Such an AI would likely be trained on existing maps, and would have these errors baked into it. Some common errors are 1 misuse of choropleth maps, 2 use of ZIP codes as aerial units, 3 not citing the data used in the map/original research, and 4 inappropriate projection choice.
ZIP Codes (and other inappropriate enumeration unit choice): This is a bit specific to the United States, but ZIP codes are not actually polygons, and should not be used for mapping demographic information. Maps like the MA ZIP code map attached are not representative of reality. Furthermore, ZIP code boundary files are not actually published by the United States government, they are ALL 3rd party products. I can point to several sources on this including the U.S. Census, and peer reviewed publications. Barnstable MA zip codes (02655 Osterville highlighted)
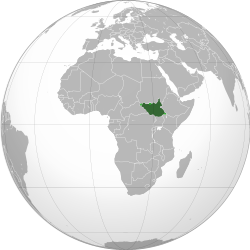
Maps lacking Citations: Using the ZIP Code map as an example, in cartography we must cite our data, and boundaries are considered data. It should be obvious to say, but borders are man made constructs that not everyone agrees upon, and therefore it is necessary to indicate where you got your boundaries from. in a map. This has come up several times on various products, but as I said, ZIP code boundaries are all 3rd party products. If you open the ZIP code map, it is in the creative commons and listed as "Own work." Either a person has drawn the boundaries themselves, which would be original research, or they are not properly attributing where they got these from, which is what I suspect, and committing plagiarism or a likely copyrighted set of boundaries. This problem is extremely wide spread, for example, look at the locator map for South SudanSouth Sudan (orthographic projection) highlighted. If you look at the sources, they list other Wikimedia commons files. If you go through these various files, you'll see the source is often listed as "own work" and no indication of where these came from is included. I believe the worst part is that if you look at the files it is based on, the disputed areas were drawn on by editors. In cartography, this is WP:Original research. Just like I can't write out "There is a disputed territory on the Northern border of South Sudan" without a source, I can't make a map showing that without a source. This problem is quite widespread, as many of our reference maps are based on coordinates editors grab from somewhere and never indicate where.
Inappropriate projections: This is a fairly common problem, especially in thematic maps like Choropleth or Dot density. There are some projections that are appropriate for these types of maps, and some that are almost never appropriate like Web Mercator. While there are often inappropriate projections used, most of the maps on Wikipedia give absolutely no indication on what projection they are using. I can make educated guesses most of the time, but many projections look a like, and I doubt most people are able to discriminate between them.
These are just a few of the things we are currently doing poorly. I don't think an automated map making software would do much better. The issue with the MOS is that when it comes to maps, we essentially have no firm MOS, and certainly not one that looks at the outside literature. It would be like ignoring standard grammar and spelling and insisting on recreating it all from scratch. The best I've seen is some application of the basic rules we would hold graphic design images to, like color and accessibility, but we can just take the cartographic standards and conventions from outside literature and apply them to the project. GeogSage (⚔Chat?⚔) 16:02, 13 October 2025 (UTC)[reply]
Good explanation of the problem. Am I wrong in seeing the principle of good enough in play? I wonder if the software design paradigm explains the bias of using bad maps. If we used and demanded good maps, would we have ever grown as a site? Also, if all we are trying to do is visualize data, are the design principles you describe important or necessary? Viriditas (talk) 16:51, 13 October 2025 (UTC)[reply]
Here are some relevant quotes:
"Any body can publish any kind of a map, however bad, and get away with it. Ordinarily' a field is subject to the law of natural selection-the things that are bad or inadequate fail to survive. But in cartography this law does not operate effectively because the ability to dis criminate among maps is not widespread in this country"
Poor cartographic training has resulted in poor maps, but the average American, unable to discriminate between good and bad maps, has brought no pressure to bear on producers of poor maps.
Because most map users willingly tolerate white lies on maps, it's not difficult for maps also to tell more serious lies. Map users generally are a trusting lot: they understand the need to distort geometry and suppress features, and they believe the cartographer really does know where to draw the line, figuratively as well as literally. As with many things beyond their full understanding, they readily entrust mapmaking to a priesthood of technically competent designers and drafters working for government agencies and commercial firms. Yet cartographers are not licensed, and many mapmakers competent in commercial art or the use of computer workstations have never studied cartography. Map users seldom, if ever, question these authorities, and they often fail to appreciate the map's power as a tool of deliberate falsification or subtle propaganda.
Misuse may occur by misunderstanding basic geographic requirements such as reprojecting the data for minimum error when the user moves from a world map to a regional map (online mapping capabilities typically do not reproject data on zoom-ins), ignoring the effects of scale, being unable to select appropriate data classification categories and so on. :Misuse is especially likely among users with little or no familiarity with spatial data analysis. This danger is separate from the lack of familiarity users may have with the capabilities of the software. Both of these dangers are implications of the convergence of spatial technologies and suggest that anyone can now be a cartographer. As cartographers, therefore, it is our responsibility (though not ours alone) to ensure well- designed, data-rich maps are part of any online geographic visualization system, and to be "Internet activists" in developing good content. It is now, while the web is relatively young that we have the most opportunity to shape it.
At the risk of stretching the notion of lying, I’m convinced that inadvertent fabrication is far more common these days than intentional deceit. Moreover, because most maps now are customized, one-of-a-kind graphics that never make it into print or onto the Internet, prevaricating mapmakers often lie more to themselves than to an audience. Blame technology—a conspiracy between user-friendly mapping software (or notso-user-friendly geographic information systems) and high-resolution laser printers that can render crisp type and convincing symbols with little effort or thought.
— Mark Monmonier, 2005 (linked above)
Because abstract representations of data can distort almost as readily as they can reveal, analytical tools are also rhetorical instruments fully capable of “lying” in the hands of malevolent, naive, or sloppily expedient authors.
— Mark Monmonier, 2005 (linked above)
Widely available software to create web-based maps is very user-friendly and has no prerequisites of cartographic or Geographic Information Systems (GIS) skills. This can exacerbate the spread of maps of questionable quality on the Internet.
The use of case count maps might also be a subtle facilitator of the extreme political polarization surrounding measures to combat COVID that has occurred in the United States.
On Wikipedia, we have some policies. For example, Wikipedia:Verifiability states we need citations for direct quotations, and that Wikipedia:No original research is allowed. If we are trying to visualize the data, we want to minimize distortion of that underlying data. The principles I am describing are the bare minimum, not some high bar.metawiki:Anti-Disinformation_Repository states "Wikimedia communities have been working for years to promote trustworthy information and to act against disinformation." Certainly, if we dropped our standards for citations and didn't demand good writing, we could have grown as a site. Unfortunately, as most people are completely unfamiliar with cartography, they drop all standards and requirements when it comes to maps. To quote myself above "It is pretty hard to discuss with anonymous online people. Imagine getting three degrees on a topic, publishing multiple papers in various formats on it, getting a position as a professor teaching it, and then when you try to weigh in on a conversation three people who are probably not qualified to take your intro class tell you that the criteria you're advocating for is not really a big deal, and the status quo remains." With that context, please re-read your last comment. GeogSage (⚔Chat?⚔) 18:41, 13 October 2025 (UTC)[reply]
Again, great points. But again, if Wikipedia is based on a software design paradigm that accepts a good enough approach, you are going to have a tough time breaking through that framework unless you can revise it to accommodate and accept your changes. I 100% support you because you’ve convinced me. But how are you going to convince the others? One way forward is to create a simple roadmap with milestones. Make the first milestone something that can be reached in a year or so. What is it that needs to be done first that is a reasonable goal? You will want something small and incremental. What’s the first step? Viriditas (talk) 19:43, 13 October 2025 (UTC)[reply]
I'm honestly not sure, at one point I thought to post something on Wikipedia:WikiProject Maps, or create a task force there, but that ultimately went no where. Unfortunately, people really don't want to face the reality that most of the maps we use are flawed in ways that would be unacceptable in most contexts, and because many are hosted in the Wikimedia commons, we are likely spreading this across the broader internet. One of the maps I created and hosted was used in an article by The Tyee for example (see here). While I'm fairly confident in that product, it goes to show our influence is broader then just Wikipedia alone. The way Wikipedia is structured, if the average person (editor) doesn't think something is "important or necessary" then any attempt one (or several) editors to change that thing will fall flat. In my experience, sources don't matter because they won't read them, and people rarely change their mind after an initial stance is taken. GeogSage (⚔Chat?⚔) 22:09, 13 October 2025 (UTC)[reply]
You've touched on many topics that are of interest to me. What does it take for someone to change their mind and how does the process work? How does a paradigm shift occur? I think you need to start small. That map you created is great. Although I have often wondered if that data is even correct. The way poverty is measured is controversial.[2]Viriditas (talk) 22:19, 13 October 2025 (UTC)[reply]
The data is what the data are, if we cite our sources, the sin of inaccurate data is not on us but on those who erroneously published it. Even if we can and should create a new, better, poverty formula, the old one has a benefit of being backwards compatible. More measurements are better then fewer, and none of them are the absolute Truth. In the case of the map I made, I created it to demonstrate the Jenks natural breaks optimization when I made the page for George F. Jenks, the data itself was a secondary concern. It was (pleasantly) surprising to see a news agency pick it up, even if it is a small one, but demonstrates how a map can be lifted from the original context and spread over the internet for vastly different reasons then the cartographer made it for. This game of telephone is why we need to be careful with our maps on Wiki, imagine a similar map being published showing incorrect borders with no citation. In a case where a Wikipedia editor publishes a map where they themselves created the borders, data, or whatever, the sin of inaccurate data would rest on us for hosting it.
When it comes to changing someone's mind, I'm a bit at a loss. I've been able to "convert" people on some cartographic/geographic topics IRL, but by record on Wikipedia for winning hearts and minds is abysmal. Another example, my recent attempt(s) to shift away from using the term continent as a primary descriptor for regions, especially Europe, has been met with a lot of resistance. Most of my success has been in the classroom, and I think this might be because people are more open minded to changing ideas when they are in that setting. GeogSage (⚔Chat?⚔) 02:07, 15 October 2025 (UTC)[reply]
You can see it clearly on the Talk:Europe. Generally speaking, continents are a fairly meaningless term. It is a lot like the term Race (human categorization), from a scientific standpoint the term continent (as we use it) is "essentialism obsolete." There are several different models (you can see on the continent page) and the one we generally endorse on Wikipedia includes Europe. The gist of it is though (and the tl;dr from that talk page), "From an academic perspective, there are several sources that not only state clearly that Europe does not really meet the definition of a continent, but go on to state that the reason Europe was ever included is rooted in colonialism."
I advocate for a shift to the more ambiguous and less loaded term region for ledes, and then mentioning in history sections that in some models the area was considered a continent. Why is Europe a continent, while India (with it's own tectonic plate) is a "Sub-continent." Why is the Middle East not a continent? Why isn't the Caribbean? There isn't actually a definition that define continent that is inclusive of Europe and results in the same division we teach in the west, other then we think Europe "deserves" that special status. Fundamentally, continents are an outdated model from a time where we were missing many of the pieces. Viewing Europe and Asia as parts of a single continent would have been far more geographically accurate, but it would also have failed to grant Europe the priority that Europeans and their descendants overseas believed it deserved. I proposed a lede re-wright that was less nakedly biased towards using the Western model, brought sources, proposed ways we could include the historic definition of continent, and was met with two or three editors blocking, with no alternative proposal, sources, or really anything besides a 5th grade understanding of geography. Specifically, I proposed some variation of "Europe is a geographic region consisting of a peninsula and several outlying islands on the Eurasian plate, located entirely in the Northern Hemisphere and mostly in the Eastern Hemisphere."GeogSage (⚔Chat?⚔) 17:06, 15 October 2025 (UTC)[reply]
Thanks for explaining. What is the major objection? I’ve seen proposals similar to yours in other topics, and they basically succeed or fail based on the criterion of usage. As a tertiary source, Wikipedia will happily change its use of a word if other sources have as well. That should be the thrust of your argument to move your proposal forward, showing how other reliable sources have deprecated the word in favor of others. Viriditas (talk) 18:54, 15 October 2025 (UTC)[reply]
The major objection can be summarized with: "Are you seriously asking for sources saying Europe is a continent? The sources provided themselves note it is the default framework, hence their pushing back against it." You can read through the discussion, it is quite frustrating. When telling American's that their 5th grade education isn't accurate, it's like arguing with a brick wall. I provided 8 sources discussing the topic, and well, the policy on "Wikipedia:Consensus" is an ideal that usually becomes a vote based on knee jerk reactions from the Wikipedia community. GeogSage (⚔Chat?⚔) 19:04, 15 October 2025 (UTC)[reply]
I partly read through the discussion. There are several problems that I noticed: it isn't all that clear what the preferred outcome should be, as the topic bifurcates and keeps changing. You state your goal in the beginning, but by the end, nobody is sure what is going on. I think a more structured WP:RFC that is split into smaller chunks is better. There is a right way to do this, but unfortunately, I'm the wrong person to ask. Viriditas (talk) 20:00, 15 October 2025 (UTC)[reply]
The main thing I wanted done was to drop the word "continent" from the lede, and mention the historic model later in the article. Nobody actually has an argument for the status quo, so they stonewall, split the discussion, never present any sources or alternatives, call me tedious, and then never reply. This is my general experience with Wikipedia, three or so editors ignore the outside world in favor of their first knee jerk reaction, and the result ends up being a straight vote, where the arguments weight or sources don't matter. It is annoying when arguing something from a field you're an expert in, like trying to convince three people who have never been outside that the sky is blue and grass won't burn if they touch it. Navigating the creation of a RfC is exhausting, I'm not quite sure how to even start that. GeogSage (⚔Chat?⚔) 22:04, 15 October 2025 (UTC)[reply]
Coming up with a RFC statement and posting this RFC is easy. First thing to do is write everything and format the RFC before you go and post it. It's going to look something like this (replace this with your own wording):
== RfC about dropping continent from the lede =={{rfc|hist}}This is a proposal to drop the word "continent" from the lede and mention the historical model later in the article. There are problems with using the word "continent" in the lede, as Europe is not best defined by that term. I propose referring to it as a "region" instead for accuracy based on our best, most current sources x, y, and z.
===Support===#===Oppose ===#===Discussion===
Once you post that, Legobot will take over and advertise your RFC to the rest of Wikipedia. The key to a successful RFC is to keep your proposals and comments as short as possible. Maybe 2-4 sentences max. That means condensing your entire proposal into a very small string of words. That's the hardest part, IMO. Viriditas (talk) 22:31, 15 October 2025 (UTC)[reply]
I have a third article I need a map for soon. It's a work in progress and is nowhere near complete. The map is meant to visualize the 300 mile trail of a mounted posse in 1889 through the Arizona and Utah territories, before either of them became a state. I bet that's a challenge! How would a cartographer approach this? I have a roughly drawn map with the trail that was published in another work, but it's extremely primitive and almost worthless, but it is a good way to get started. Where should I begin if I want to accurately map the territories and routes? I really like the black and white look of datawrapper, but I'm open to other designs. Viriditas (talk) 07:48, 15 October 2025 (UTC)[reply]
This is actually fairly easy to do, challenging to do right. You would probably start with QGIS. What needs to happen is a vector file (probably a shapefile) representing the trail would need to be created. It is ultimately as easy as drawing in any graphics software. Shapefiles can be lines, polygons, or points. The issue is accuracy, you'd need to start with your "known" values, and you would need Citations for these. I'd start with the coordinates of the beginning and end of the trail, then as many known stop points as possible. Then, you can get more complex, if you have a map published in another work you can georeference it (instructions for QGIS here). Then, once you have the Raster tied to a set of coordinates in the GIS, you can digitize it (essentially, trace it. steps in QGIS here). From there, you have the line you can use for your trail. The issue is there is a certain amount of "Trust me bro" in this process, and there is an art and science to it, along with a half century of literature. Citing the original map, and where you got the original coordinates from, would likely be enough citation to avoid a loose "original research" accusation, but it might be synth. In cartography, we sign our work in addition to citing our sources, because the finished product is a new model of reality. I'm not quite sure how original maps fit with Wikipedia policy because of this, and am certain that not much thought has been given to the problem. GeogSage (⚔Chat?⚔) 17:20, 15 October 2025 (UTC)[reply]
Start with an excel table with three columns, X_Coord, Y_Coord, ID, source. Assuming the X and Y are in the same coordinate system for each point, you can use a table like this in QGIS to get your starting points. GeogSage (⚔Chat?⚔) 18:57, 15 October 2025 (UTC)[reply]
Drafts that go unedited for six months are eligible for deletion, in accordance with our draftspace policy, and this one has been nominated for deletion. If you plan on working on it further, or editing it to address the issues raised if it was declined, simply edit the submission, and remove the {{db-afc}}, {{db-draft}}, or {{db-g13}} code.
If your submission has already been deleted by the time you read this, you can request its undeletion. An administrator will, in most cases, restore the draft so you can continue to work on it.


.svg)
_highlighted.svg)
