VVC weather station
55°50′0″N 37°37′0″E / 55.83333°N 37.61667°E
_september_2024.jpg)

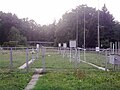
The VDNKh weather station is the principal weather station in Moscow, Russia. It opened in 1948 on the grounds of the All-Russia Exhibition Centre. The station's World meteorological organization classification index is 27612.
-
 View to North-West
 -
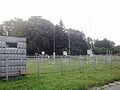
 View to West
 -
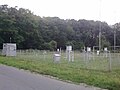
 View to South-West
 -
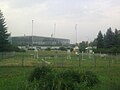
 View to East
 -
 View to North-West
 -
 View to South-West
 -
 View to North
 -
 View to South


Climatological data
[edit]| Climate data for Moscow (weather records since 1948 (by VDNKh weather station only)) | |||||||||||||
|---|---|---|---|---|---|---|---|---|---|---|---|---|---|
| Month | Jan | Feb | Mar | Apr | May | Jun | Jul | Aug | Sep | Oct | Nov | Dec | Year |
| Record high °C (°F) | 8.6 (47.5) |
8.3 (46.9) |
19.7 (67.5) |
28.9 (84.0) |
33.2 (91.8) |
34.8 (94.6) |
38.2 (100.8) |
37.3 (99.1) |
29.4 (84.9) |
23.7 (74.7) |
16.2 (61.2) |
9.6 (49.3) |
38.2 (100.8) |
| Record low °C (°F) | −38.1 (−36.6) |
−35.2 (−31.4) |
−27.9 (−18.2) |
−18.8 (−1.8) |
−5.0 (23.0) |
0.8 (33.4) |
5.1 (41.2) |
2.1 (35.8) |
−5.2 (22.6) |
−16.1 (3.0) |
−23.3 (−9.9) |
−38.0 (−36.4) |
−38.1 (−36.6) |
| Source: [1][2][3] | |||||||||||||
| Climate data for Moscow (VDNKh) WMO ID: 27612; coordinates 55°49′53″N 37°37′20″E / 55.83139°N 37.62222°E; elevation: 147 m (482 ft); 1991–2020 normals, extremes 1879–present | |||||||||||||
|---|---|---|---|---|---|---|---|---|---|---|---|---|---|
| Month | Jan | Feb | Mar | Apr | May | Jun | Jul | Aug | Sep | Oct | Nov | Dec | Year |
| Record high °C (°F) | 8.6 (47.5) |
8.3 (46.9) |
19.7 (67.5) |
28.9 (84.0) |
33.2 (91.8) |
34.8 (94.6) |
38.2 (100.8) |
37.3 (99.1) |
32.3 (90.1) |
24.0 (75.2) |
16.2 (61.2) |
9.6 (49.3) |
38.2 (100.8) |
| Mean maximum °C (°F) | 2.8 (37.0) |
3.5 (38.3) |
10.8 (51.4) |
21.7 (71.1) |
27.3 (81.1) |
29.5 (85.1) |
31.0 (87.8) |
30.0 (86.0) |
24.7 (76.5) |
17.9 (64.2) |
8.9 (48.0) |
4.2 (39.6) |
31.9 (89.4) |
| Mean daily maximum °C (°F) | −3.9 (25.0) |
−3 (27) |
3.0 (37.4) |
11.7 (53.1) |
19.0 (66.2) |
22.4 (72.3) |
24.7 (76.5) |
22.7 (72.9) |
16.4 (61.5) |
8.9 (48.0) |
1.6 (34.9) |
−2.3 (27.9) |
10.1 (50.2) |
| Daily mean °C (°F) | −6.2 (20.8) |
−5.9 (21.4) |
−0.7 (30.7) |
6.9 (44.4) |
13.6 (56.5) |
17.3 (63.1) |
19.7 (67.5) |
17.6 (63.7) |
11.9 (53.4) |
5.8 (42.4) |
−0.5 (31.1) |
−4.4 (24.1) |
6.3 (43.3) |
| Mean daily minimum °C (°F) | −8.7 (16.3) |
−8.8 (16.2) |
−4.2 (24.4) |
2.3 (36.1) |
8.1 (46.6) |
12.2 (54.0) |
14.8 (58.6) |
13.0 (55.4) |
8.0 (46.4) |
3.0 (37.4) |
−2.4 (27.7) |
−6.5 (20.3) |
2.6 (36.7) |
| Mean minimum °C (°F) | −21.1 (−6.0) |
−20.9 (−5.6) |
−12.8 (9.0) |
−5.1 (22.8) |
0.3 (32.5) |
5.8 (42.4) |
9.7 (49.5) |
6.8 (44.2) |
0.9 (33.6) |
−4.6 (23.7) |
−11.7 (10.9) |
−17.3 (0.9) |
−23.9 (−11.0) |
| Record low °C (°F) | −42.1 (−43.8) |
−38.2 (−36.8) |
−32.4 (−26.3) |
−21 (−6) |
−7.5 (18.5) |
−2.3 (27.9) |
1.3 (34.3) |
−1.2 (29.8) |
−8.5 (16.7) |
−20.3 (−4.5) |
−32.8 (−27.0) |
−38.8 (−37.8) |
−42.1 (−43.8) |
| Average precipitation mm (inches) | 53 (2.1) |
44 (1.7) |
39 (1.5) |
37 (1.5) |
61 (2.4) |
78 (3.1) |
84 (3.3) |
78 (3.1) |
66 (2.6) |
70 (2.8) |
52 (2.0) |
51 (2.0) |
713 (28.1) |
| Average extreme snow depth cm (inches) | 24 (9.4) |
35 (14) |
29 (11) |
2 (0.8) |
0 (0) |
0 (0) |
0 (0) |
0 (0) |
0 (0) |
0 (0) |
4 (1.6) |
12 (4.7) |
35 (14) |
| Average rainy days | 8 | 6 | 9 | 15 | 16 | 16 | 15 | 16 | 16 | 17 | 13 | 8 | 155 |
| Average snowy days | 25 | 23 | 15 | 6 | 1 | 0 | 0 | 0 | 0.3 | 5 | 17 | 24 | 116 |
| Average relative humidity (%) | 85 | 81 | 74 | 68 | 67 | 72 | 74 | 78 | 82 | 83 | 86 | 86 | 78 |
| Mean monthly sunshine hours | 33 | 72 | 128 | 170 | 265 | 279 | 271 | 238 | 147 | 78 | 32 | 18 | 1,731 |
| Mean daily sunshine hours | 1.1 | 2.5 | 4.1 | 5.7 | 8.5 | 9.3 | 8.7 | 7.7 | 4.9 | 2.5 | 1.1 | 0.6 | 4.7 |
| Mean daily daylight hours | 7.9 | 9.7 | 11.9 | 14.3 | 16.3 | 17.4 | 16.8 | 14.9 | 12.7 | 10.5 | 8.4 | 7.2 | 12.3 |
| Percentage possible sunshine | 14 | 27 | 35 | 40 | 53 | 53 | 52 | 51 | 38 | 24 | 13 | 8 | 34 |
| Average ultraviolet index | 0 | 1 | 2 | 3 | 5 | 6 | 6 | 5 | 3 | 1 | 1 | 0 | 3 |
| Source 1: Pogoda.ru.net,[4][5] Thermograph.ru,[6] Meteoweb.ru (sunshine hours)[7] | |||||||||||||
| Source 2: Weather Atlas (UV)[8] | |||||||||||||
See also
[edit]Wikimedia Commons has media related to All-Russia Exhibition Centre weather station.
References
[edit]- ^ "2008 was the warmest year in Moscow history (in Russian)". Archived from the original on 2020-04-13. Retrieved 2009-02-05.
- ^ "Pogoda.ru.net" (in Russian). Retrieved January 8, 2009.
- ^ "August high" (in Russian). Retrieved August 7, 2010.
- ^ "Pogoda & Climate (Weather & Climate)" (in Russian). Retrieved 29 October 2021.
- ^ "Climate monitor 2005-2011" (in Russian). Retrieved 29 October 2021.
- ^ "Thermograph.ru averages". Retrieved 12 January 2011.
- ^ "Average monthly Sunshine hours" (in Russian). Meteoweb.ru. Retrieved 12 January 2011.
- ^ "Moscow, Russia - Detailed climate information and monthly weather forecast". Weather Atlas. Yu Media Group. Retrieved 4 July 2019.