Good Hope, California
Good Hope, California | |
|---|---|
 Santa Rosa Mine Road, Good Hope, California | |
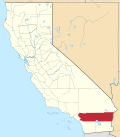
 Location of Good Hope in Riverside County, California. | |
 Good Hope, California Position in California. | |
| Coordinates: 33°46′14″N 117°16′38″W / 33.77056°N 117.27722°W | |
| Country | United States |
| State | California |
| County | Riverside |
| Area | |
• Total | 11.234 sq mi (29.097 km2) |
| • Land | 11.234 sq mi (29.097 km2) |
| • Water | 0 sq mi (0 km2) 0% |
| Elevation | 1,624 ft (495 m) |
| Population | |
• Total | 9,468 |
| • Density | 842.8/sq mi (325.4/km2) |
| Time zone | UTC-8 (Pacific (PST)) |
| • Summer (DST) | UTC-7 (PDT) |
| ZIP code | 92570[4] |
| Area code | 951 |
| GNIS feature ID | 2583026 |
Good Hope is a census-designated place in Riverside County, California.[2] Good Hope sits at an elevation of 1,624 feet (495 m).[2] The 2020 United States census reported Good Hope's population was 9,468.
Geography
[edit]According to the United States Census Bureau, the CDP covers an area of 11.2 square miles (29.1 km2), all of it land.
Climate
[edit]The climate in this area is described by the Köppen Climate Classification System as "dry-summer subtropical" often referred to as "Mediterranean" and abbreviated as Csa.[5]
| Climate data for Good Hope, CA | |||||||||||||
|---|---|---|---|---|---|---|---|---|---|---|---|---|---|
| Month | Jan | Feb | Mar | Apr | May | Jun | Jul | Aug | Sep | Oct | Nov | Dec | Year |
| Mean daily maximum °F (°C) | 63 (17) |
67 (19) |
69 (21) |
74 (23) |
80 (27) |
87 (31) |
96 (36) |
96 (36) |
96 (36) |
87 (31) |
74 (23) |
66 (19) |
80 (27) |
| Mean daily minimum °F (°C) | 36 (2) |
37 (3) |
39 (4) |
43 (6) |
47 (8) |
50 (10) |
57 (14) |
57 (14) |
55 (13) |
46 (8) |
41 (5) |
37 (3) |
45 (7) |
| Average precipitation inches (mm) | 3.8 (97) |
0.9 (23) |
1.6 (41) |
0.9 (23) |
0.4 (10) |
0 (0) |
0.1 (2.5) |
0 (0) |
0.2 (5.1) |
0 (0) |
1.2 (30) |
1.5 (38) |
10.7 (270) |
| Source: Weatherbase [6] | |||||||||||||
Demographics
[edit]| Census | Pop. | Note | %± |
|---|---|---|---|
| 2010 | 9,192 | — | |
| 2020 | 9,468 | 3.0% | |
| U.S. Decennial Census[7] 1850–1870[8][9] 1880-1890[10] 1900[11] 1910[12] 1920[13] 1930[14] 1940[15] 1950[16] 1960[17] 1970[18] 1980[19] 1990[20] 2000[21] 2010[22] | |||
Good Hope first appeared as a census designated place in the 2010 U.S. census.[22]
The 2020 United States census reported that Good Hope had a population of 9,468. The population density was 842.8 inhabitants per square mile (325.4/km2). The racial makeup of Good Hope was 18.4% White, 4.1% African American, 1.8% Native American, 0.7% Asian, 0.0% Pacific Islander, 53.7% from other races, and 21.4% from two or more races. Hispanic or Latino of any race were 86.2% of the population.[23]
The census reported that 99.9% of the population lived in households, 7 people (0.1%) lived in non-institutionalized group quarters, and no one was institutionalized.[23]

There were 2,198 households, out of which 52.5% included children under the age of 18, 54.3% were married-couple households, 7.2% were cohabiting couple households, 20.2% had a female householder with no partner present, and 18.2% had a male householder with no partner present. 10.6% of households were one person, and 4.0% were one person aged 65 or older. The average household size was 4.3.[23] There were 1,872 families (85.2% of all households).[24]
The age distribution was 29.6% under the age of 18, 11.9% aged 18 to 24, 26.4% aged 25 to 44, 22.6% aged 45 to 64, and 9.5% who were 65 years of age or older. The median age was 30.2 years. For every 100 females, there were 107.4 males.[23]
There were 2,338 housing units at an average density of 208.1 units per square mile (80.3 units/km2), of which 2,198 (94.0%) were occupied. Of these, 60.5% were owner-occupied, and 39.5% were occupied by renters.[23]
In 2023, the US Census Bureau estimated that 29.9% of the population were foreign-born. Of all people aged 5 or older, 34.7% spoke only English at home, 64.8% spoke Spanish, and 0.5% spoke Asian or Pacific Islander languages. Of those aged 25 or older, 64.9% were high school graduates and 4.3% had a bachelor's degree.[25]
The median household income in 2023 was $56,328, and the per capita income was $19,511. About 20.2% of families and 27.6% of the population were below the poverty line.[26]
Education
[edit]Residents are zoned to the Perris Elementary School District and the Perris Union High School District for grades 7-12.[27]
References
[edit]- ^ "2020 U.S. Gazetteer Files". United States Census Bureau. Retrieved October 30, 2021.
- ^ a b c U.S. Geological Survey Geographic Names Information System: Good Hope, California
- ^ "US Census Bureau". www.census.gov. Retrieved September 10, 2024.
- ^ "Good Hope ZIP Code". zipdatamaps.com. 2023. Retrieved January 12, 2023.
- ^ Climate Summary for Good Hope, California
- ^ "Weatherbase.com". Weatherbase. 2013. Retrieved on September 4, 2013.
- ^ "Decennial Census by Decade". United States Census Bureau.
- ^ "1870 Census of Population - Population of Civil Divisions less than Counties - California - Almeda County to Sutter County" (PDF). United States Census Bureau.
- ^ "1870 Census of Population - Population of Civil Divisions less than Counties - California - Tehama County to Yuba County" (PDF). United States Census Bureau.
- ^ "1890 Census of Population - Population of California by Minor Civil Divisions" (PDF). United States Census Bureau.
- ^ "1900 Census of Population - Population of California by Counties and Minor Civil Divisions" (PDF). United States Census Bureau.
- ^ "1910 Census of Population - Supplement for California" (PDF). United States Census Bureau.
- ^ "1920 Census of Population - Number of Inhabitants - California" (PDF). United States Census Bureau.
- ^ "1930 Census of Population - Number and Distribution of Inhabitants - California" (PDF). United States Census Bureau.
- ^ "1940 Census of Population - Number of Inhabitants - California" (PDF). United States Census Bureau.
- ^ "1950 Census of Population - Number of Inhabitants - California" (PDF). United States Census Bureau.
- ^ "1960 Census of Population - General population Characteristics - California" (PDF). United States Census Bureau.
- ^ "1970 Census of Population - Number of Inhabitants - California" (PDF). United States Census Bureau.
- ^ "1980 Census of Population - Number of Inhabitants - California" (PDF). United States Census Bureau.
- ^ "1990 Census of Population - Population and Housing Unit Counts - California" (PDF). United States Census Bureau.
- ^ "2000 Census of Population - Population and Housing Unit Counts - California" (PDF). United States Census Bureau.
- ^ a b "2010 Census of Population - Population and Housing Unit Counts - California" (PDF). United States Census Bureau.
- ^ a b c d e "Good Hope CDP, California; DP1: Profile of General Population and Housing Characteristics - 2020 Census of Population and Housing". US Census Bureau. Retrieved May 21, 2025.
- ^ "Good Hope CDP, California; P16: Household Type - 2020 Census of Population and Housing". US Census Bureau. Retrieved May 21, 2025.
- ^ "Good Hope CDP, California; CP02: Comparative Social Characteristics in the United States - 2023 ACS 5-Year Estimates Comparison Profiles". US Census Bureau. Retrieved May 21, 2025.
- ^ "Good Hope CDP, California; DP03: Selected Economic Characteristics - 2023 ACS 5-Year Estimates Comparison Profiles". US Census Bureau. Retrieved May 21, 2025.
- ^ "2020 CENSUS - SCHOOL DISTRICT REFERENCE MAP: Riverside County, CA" (PDF). U.S. Census Bureau. p. 2 (PDF p. 3/6). Retrieved October 4, 2024. - Text list